I've always been frustrated by how surface-level most stock research tools are. You get a P/E ratio, maybe a price target, and a "buy/hold/sell" that feels like a coin flip. The real signal — what management actually says on earnings calls, whether they follow through on promises, and how the market reacts — is buried in hours of transcripts that nobody has time to read.
So I built TickerTalker.
What is it?
TickerTalker is an AI-powered stock analysis platform that digs into earnings call transcripts and financial data to give you a deeper understanding of the companies you're researching. Enter a ticker symbol, and you get a comprehensive breakdown that would normally take hours of manual research.
The platform has six core features:
- Symbol Deep Dive — the main research page for any stock
- AI Analyst Chatbot — conversational research assistant per symbol
- Stock Screener — filter the entire market by fundamentals
- Compare Stocks — side-by-side multi-stock comparison
- Portfolio Backtesting — test portfolio performance vs. S&P 500
- Curated Watchlists — 28 thematic lists across sectors
The symbol page: everything in one view
The heart of TickerTalker is the symbol page. When you look up a stock like AAPL, you get a two-column layout: data cards on the left (2/3 width) and an AI analyst chatbot on the right (1/3 width).
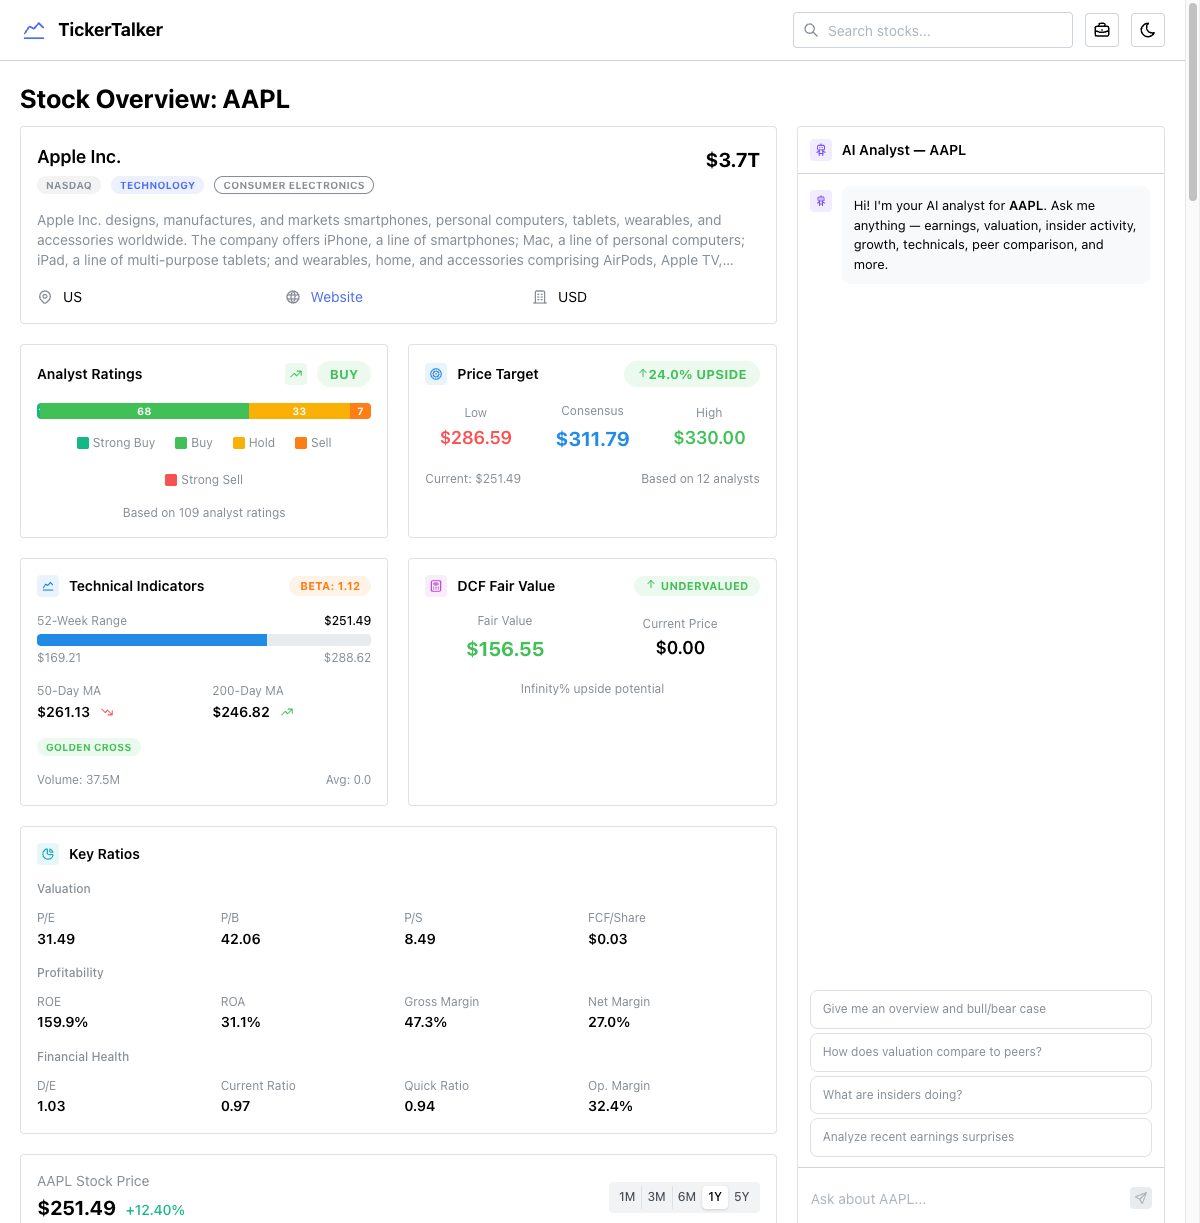
The left column packs in an enormous amount of data:
- Company overview with sector, market cap, and description
- Analyst ratings with a visual breakdown of Strong Buy / Buy / Hold / Sell
- Price target showing low, consensus, and high targets vs. current price
- Technical indicators — 52-week range, moving averages, golden cross / death cross detection
- DCF fair value with upside/downside calculation
- Key ratios — P/E, P/B, P/S, ROE, ROA, margins, D/E, current ratio
- Interactive price chart with 1M/3M/6M/1Y/5Y timeframes and SPY relative performance
- Income statement, cash flow, and balance sheet with quarterly/annual toggle
- Revenue breakdown by product and geography
- Growth trends — YoY revenue and EPS growth
- Earnings quality — operating cash flow vs. net income ratio
- Insider trading timeline overlaid on the price chart
- Ownership breakdown — insider vs. float, institutional holders
- Price correlation against SPY, QQQ, and sector peers
- Peer comparison — ratios and performance tables
- Recent news and SEC filings
- Analyst estimates — forward EPS and revenue estimates
All of this data comes from 7+ parallel API calls on the server. The page is an async server component that fetches everything concurrently with Promise.all before rendering.
The AI analyst chatbot
On the right side of every symbol page sits an AI analyst chatbot. This isn't a generic ChatGPT wrapper — it has access to 26 specialized tools that let it pull real-time financial data during the conversation:
- Company overview, historical prices, income statements
- Analyst grades, price targets, insider trading
- Institutional holders, earnings calendar, dividends
- Key ratios, cash flow, balance sheet, peer comparison
- News, SEC filings, technical indicators, DCF
- Growth metrics, earnings surprises, short interest
- Earnings quality, sector comparison, ownership breakdown, revenue segmentation
The chatbot uses the Vercel AI SDK's streamText with multi-step tool use (up to 5 rounds), so it can chain multiple data lookups to answer complex questions like "How does AAPL's margin trend compare to its peers, and what did management say about it in the last earnings call?"
The deep research pipeline
The most technically interesting part of TickerTalker is the deep research engine. It's a five-phase pipeline that runs when you trigger a deep analysis:
Phase 1: Parallel data collection
23 concurrent API calls fetch everything: earnings transcripts (last 6 quarters), income statements, price history, insider trading, institutional holders, news, SEC filings, press releases, congressional trading data, analyst estimates, technical indicators, and more.
Phase 2: Price reaction computation
Server-side calculation of how the stock reacted to each earnings report — 1-day, 5-day, and 30-day price changes, including SPY-relative performance for the same windows. This lets you see if earnings beats actually translated into stock gains.
Phase 3: Server-computed metrics
Pure computation (no AI) across multiple dimensions:
- Balance sheet health — current ratio, D/E, net debt/EBITDA
- Free cash flow quality — FCF margin, FCF/net income ratio, capex/revenue
- Valuation context — current P/E vs. 5-year average vs. sector average, PEG ratio
- Insider patterns — cluster buying detection (3+ insiders buying within 30 days)
- Institutional flow — accumulation vs. distribution signals
- Estimate revisions — are analysts revising up or down?
- Peer strength — where the stock ranks vs. peers on growth, valuation, and size
Phase 4: AI earnings analysis (Gemini 2.5 Flash)
The first AI call processes all the earnings transcripts with a forensic analyst prompt. It uses streamObject with a detailed Zod schema to extract structured data:
- Sentiment scores for each quarter (-1 to 1 scale) including CEO confidence, CFO confidence, forward guidance tone
- Hedging language score — 0 = direct/specific, 1 = heavy qualifiers
- Q&A tension — 0 = friendly softballs, 1 = hostile/confrontational
- Prepared vs. Q&A gap — 0 = consistent messaging, 1 = big disconnect between optimism in prepared remarks and defensiveness in Q&A
- Promise tracking — every commitment management made, categorized (revenue target, margin improvement, product launch, cost reduction, etc.) with status (delivered, partially delivered, missed, moved goalposts, quietly dropped)
- Guidance accuracy — did this quarter meet the guidance given last quarter?
- Key metric consistency — which KPIs did management start/stop reporting?
- Buyback execution — announced vs. actually spent
- Credibility score — 0-100 based on promise delivery rate and communication transparency
Phase 5: AI research verdict
The second AI call synthesizes everything — the deep research output, server-computed metrics, news, SEC filings, congressional trading — into a final research memo:
- Signal dashboard with 6-10 ranked signals (bullish/neutral/bearish) by category
- Overall rating — strong buy / buy / hold / sell / strong sell with confidence score
- Price target range — bear/base/bull 12-month targets
- Position sizing recommendation — full / half / quarter / avoid
- Bull and bear cases in 2-3 sentences each
- Key risks and upcoming catalysts with timeframes
- Information edge — what does this analysis reveal that a casual investor would miss?
The entire pipeline streams results via Server-Sent Events with four event types: status (progress updates), object (earnings analysis), verdict (research verdict), serverComputed (metrics), and done.
Architecture decisions
Mixed rendering strategy
Not every page uses the same rendering approach, and that's intentional:
| Page | Strategy | Why |
|---|---|---|
| Symbol | Server component, blocking | Need all data before render for a complete view |
| Macro | Server component + Suspense | Shell renders immediately, data streams in |
| Compare | Server component, blocking | Need all symbols loaded for comparison |
| Screener | Client component | Interactive filters need client state |
| Backtesting | Client component | Heavy client-side computation, localStorage |
| Watchlists index | Server component, static | JSON import, no runtime data |
Server actions as the data layer
The entire data layer (src/lib/data.ts) is marked 'use server' with 40+ exported functions. Each is a thin wrapper around the Financial Modeling Prep API client. This means:
- Server components call them directly as async functions
- Client components call them via SWR, which triggers server action RPCs under the hood
- One abstraction layer, two consumption patterns
Structured AI output with Zod
Every AI call uses Zod schemas for output validation. The deep research schema alone has ~200 fields across nested objects. This means:
- Every analysis is structurally identical and comparable across companies
- The frontend can confidently render data without null-checking everything
- Type safety flows from the AI response all the way to the React component
Portfolio backtesting
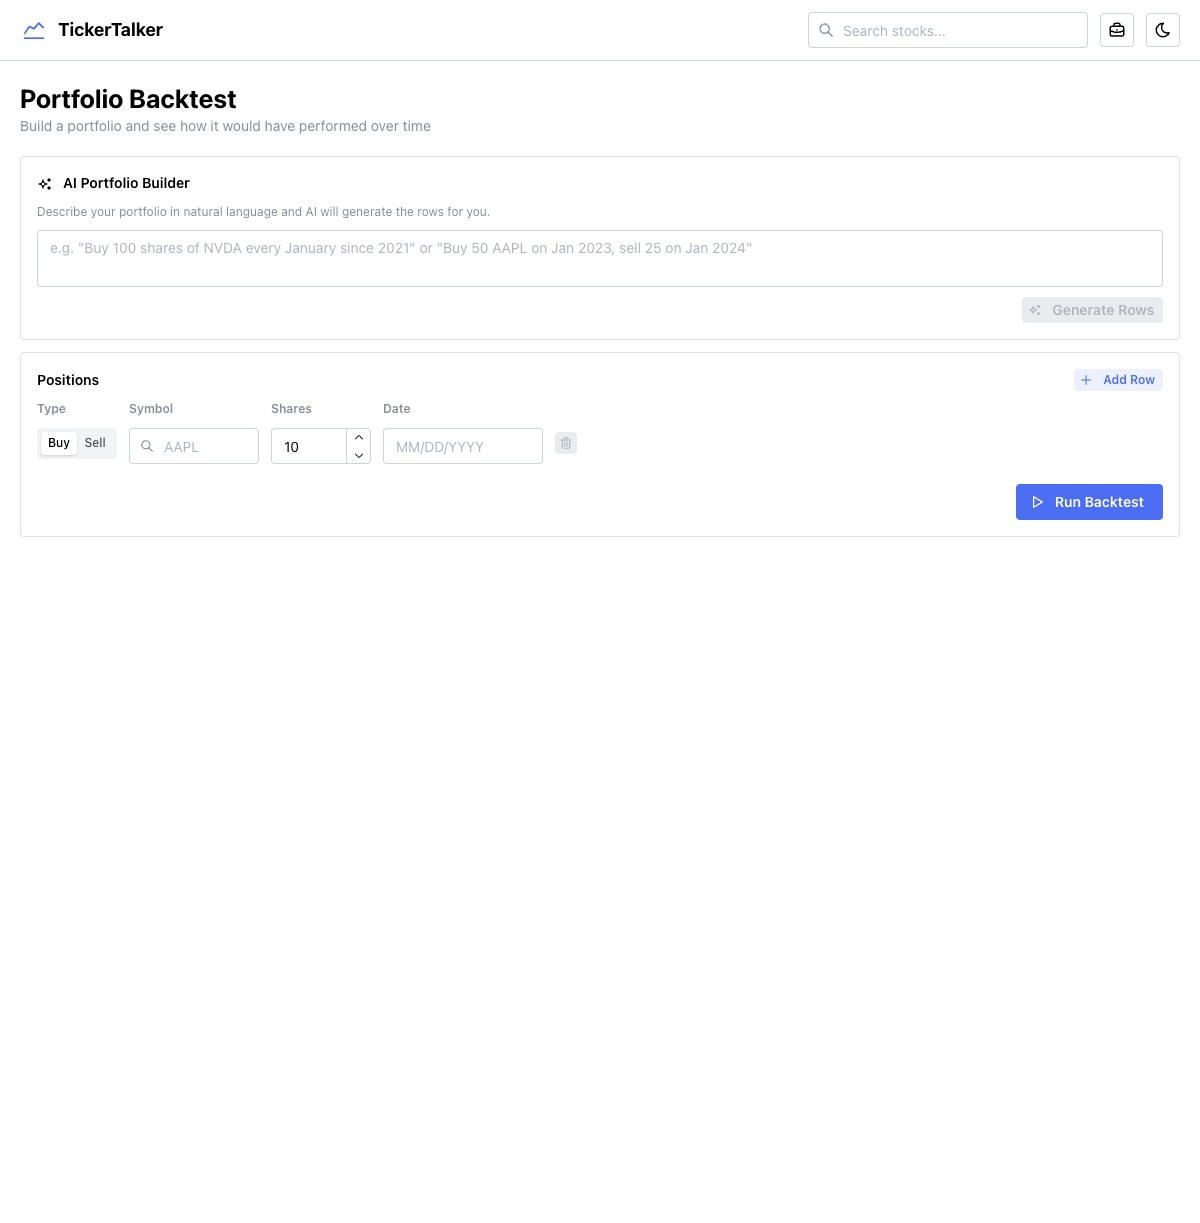
The backtesting tool lets you build a portfolio with buy/sell transactions and see how it would have performed over time. It includes an AI portfolio builder that converts natural language into structured positions — you can type "Buy 100 shares of NVDA every January since 2021" and it generates all the rows.
The computation is entirely client-side:
- Fetches historical prices for all symbols + SPY via
fetchBatchHistoricalPrices - Iterates every trading day, tracking net shares and cash from sells
- Computes daily portfolio value vs. SPY equivalent
- Calculates annualized return, alpha, and per-holding performance
Positions persist to localStorage so your portfolio survives page refreshes.
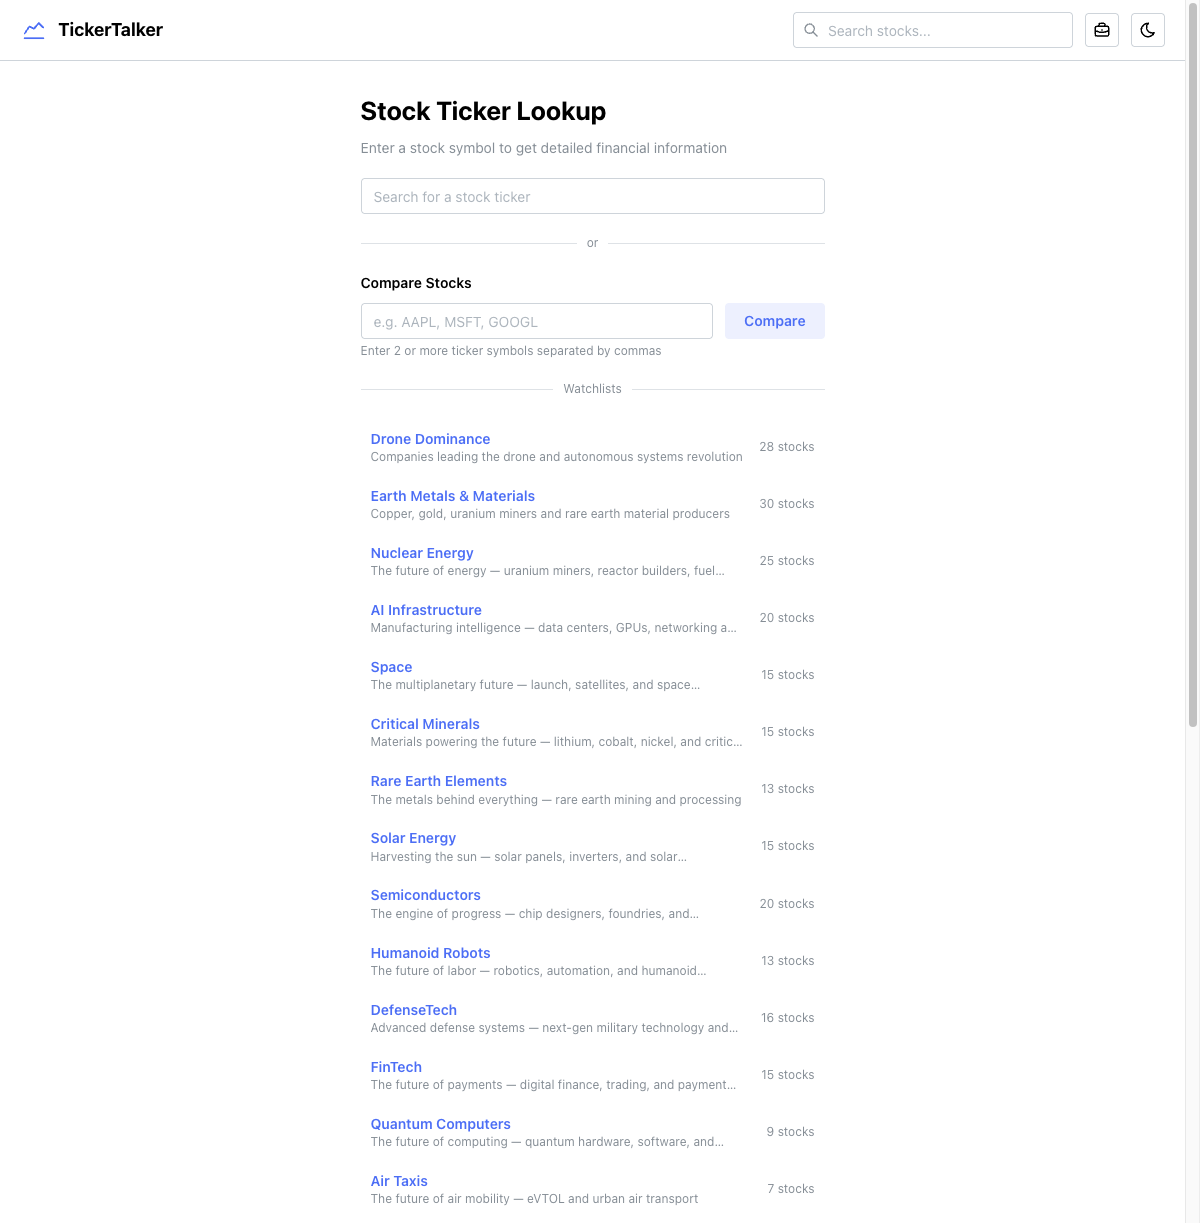
Curated watchlists
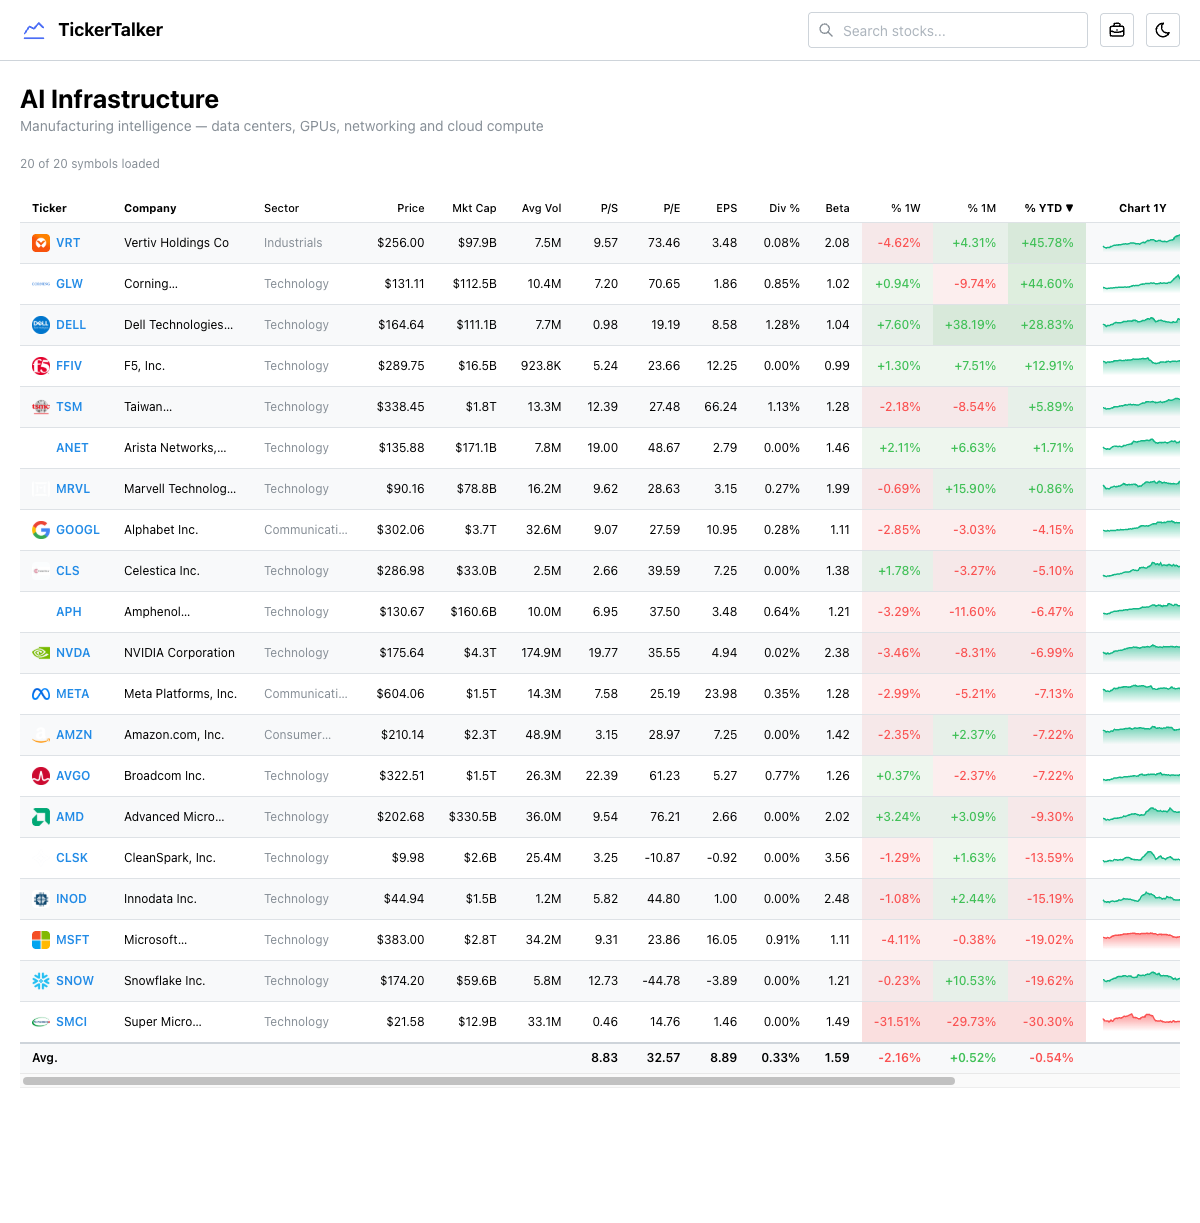
28 thematic watchlists organized by investment thesis — AI Infrastructure, Nuclear Energy, Semiconductors, Space, Drones, Quantum Computing, and more. Each list page shows a comprehensive data table with real-time fundamentals, sparkline charts, and performance metrics.
The watchlist definitions are config-driven (a static JSON file), but the data table fetches live data for every symbol on the server. The table is sortable by any column, making it easy to find the best-performing or most undervalued stock in any theme.
What's next
Ideas I'm exploring for future versions:
- Alerts and notifications — get notified when a company you're tracking has an earnings call, insider buying, or analyst upgrade
- Portfolio tracking — connect a brokerage account or manually track positions with real-time P&L
- Historical deep research — save and compare analyses over time to see how your thesis evolves
- Custom watchlists — let users create and share their own thematic lists
- Earnings calendar — a calendar view of upcoming earnings across your watchlist
- Options flow — unusual options activity as a leading indicator
- Multi-model comparison — run the same analysis through different AI models and compare outputs
- Mobile app — the current responsive layout works on mobile, but a native app would enable push notifications and better charting
Tech stack summary
- Next.js 16 — App Router, Turbopack, mixed server/client rendering
- Mantine UI — component library for all UI
- Vercel AI SDK —
streamText,streamObject,generateObjectwith tool use - Google Gemini 2.5 Flash — the AI model powering all analysis
- Financial Modeling Prep API — 40+ endpoints for financial data
- Recharts — interactive charts and sparklines
- SWR — client-side data fetching with server action integration
- Zod — structured AI output validation (~200 field schemas)
- PostHog — analytics and AI tracing
- Vercel — hosting and deployment
What I learned
Structured AI output is a game-changer. Using Zod schemas with the Vercel AI SDK means every analysis follows the exact same format. No parsing HTML, no hoping the model gives you JSON — you define the shape and the SDK handles validation. The deep research schema has ~200 fields and it works reliably.
Financial APIs are expensive and rate-limited. Financial Modeling Prep is great for the price, but you have to be smart about caching and batching requests. A single symbol page can trigger 10+ API calls, and the deep research pipeline fires 23 concurrent requests. Parallel fetching with Promise.all is essential.
Earnings calls contain more signal than most people realize. The difference between a CEO who says "we expect strong growth" and one who says "we're targeting 15% revenue growth driven by our enterprise segment" is enormous. AI is genuinely good at picking up on these nuances — hedging language, Q&A tension, quietly dropped promises — at a scale no human analyst could match.
Server actions are an underrated pattern. Having one data layer that works seamlessly from both server and client components is incredibly clean. Server components call the functions directly; client components call them through SWR. Same code, two rendering contexts.
The symbol page is a product, not a page. With 30+ data cards, an AI chatbot, and a deep research pipeline, the symbol page is really a full application. Getting the rendering strategy right — server-side for the initial load, client-side for interactivity — was the key architectural challenge.
You can try it at tickertalker.vercel.app.